March 27, 2023 permalink
An Interactive Guide to Color & Contrast →
What a nicely-designed resource for information about color theory along with some material about its use in UX and data visualization!
Site navigation:
March 27, 2023 permalink
What a nicely-designed resource for information about color theory along with some material about its use in UX and data visualization!
June 30, 2012 permalink
In this way we are backwards phrenologists, we readers. Extrapolating physiques from minds.
September 28, 2011 permalink
The Deleted City, an installation that lets visitors explore the virtual ‘homesteads’ of Geocities.com, the most popular gathering place on the 1990’s WWW. For those not familiar, the site made it easy for the average person to set up a basic website (tacky graphics and all), and then group it into a ‘neighborhood’ based on the site’s presumed subject matter.
The installation is an interactive visualisation of the 650 gigabyte Geocities backup made by the Archive Team on October 27, 2009. It depicts the file system as a city map, spatially arranging the different neighbourhoods and individual lots based on the number of files they contain.
In full view, the map is a datavisualisation showing the relative sizes of the different neighbourhoods. While zooming in, more and more detail becomes visible, eventually showing invididual html pages and the images they contain. While browsing, nearby MIDI files are played.
I love the choice of music for this demo video.
July 18, 2011 permalink
Via New Scientist, research into an image processing technique designed to mask the actual physical position of the photographer, by creating an interpolated photograph from an artificial vantage point:
The technology was conceived in September 2007, when the Burmese junta began arresting people who had taken photos of the violence meted out by police against pro-democracy protestors, many of whom were monks. “Burmese government agents video-recorded the protests and analysed the footage to identify people with cameras,” says security engineer Shishir Nagaraja of the Indraprastha Institute of Information Technology in Delhi, India. By checking the perspective of pictures subsequently published on the internet, the agents worked out who was responsible for them. …
The images can come from more than one source: what’s important is that they are taken at around the same time of a reasonably static scene from different viewing angles. Software then examines the pictures and generates a 3D “depth map” of the scene. Next, the user chooses an arbitrary viewing angle for a photo they want to post online.
Interesting stuff, but lots to contemplate here. Does an artificially-constructed photograph like this carry the same weight as a “straight” digital image? How often is an individual able to round up a multitude of photos taken of the same scene at the same time, without too much action occurring between each shot? What happens if this technique implicates a bystander who happened to be standing in the “new” camera’s position?
August 23, 2010 permalink
Yukikaze, a “physical output device for a spectrum analyzer”. The idea is surprisingly simple, with elegant results: a case with powder beads that get blown around by sixteen DC fans mounted beneath, their speed controlled by Max/MSP. Real-life visualization fun.
(Via Make)
July 4, 2010 permalink
Real-time 3D capture at 60fps using a cheap webcam and simple projected pattern of light points. The structured-light code is open source, looks like a pretty cool project.
(Via Make)
May 21, 2010 permalink
Sonar from Renaud Hallée on Vimeo.
Sonar by Renaud Hallée. Hypnotic music visualization (keyframe animated rather than generative, though). Reminds me of a cross between a backwards Osu! Tatakae! Ouendan and my favorite NASA video of all time, the Huygens Probe Descent Camera.
(Via Kitsune Noir)
March 21, 2010 permalink

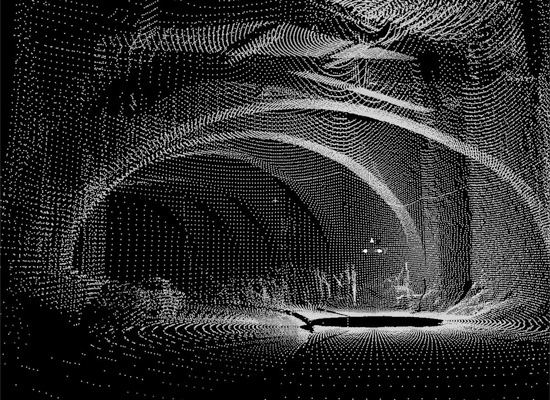
La Subterranea, a research project laser-mapping out 2km worth of the caves and tunnels running beneath Guanajuato, Mexico.
(Via Make)
March 20, 2010 permalink

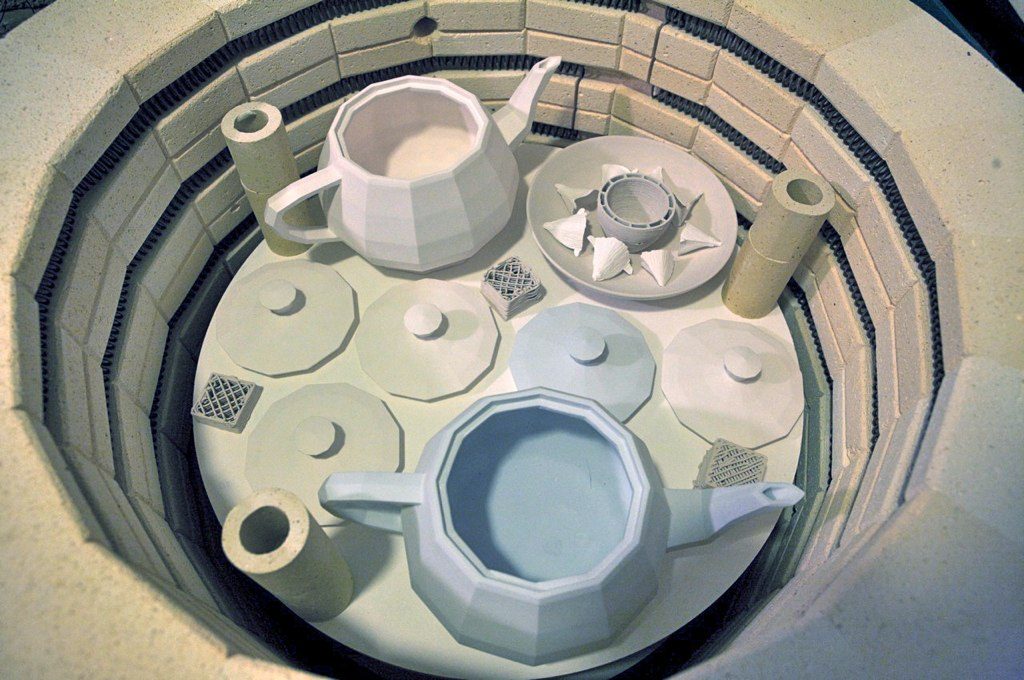
If you’re the sort of lab that’s engineering a method of printing ceramic materials using rapid prototyping machines, I suppose it’d make sense that you’d already have made some real-life polygonal Utah teapots! I never thought about it before, but for the 3D graphics humor value I really, really want one of these now. You can read about the Utanalog project and see finished photos (and a video explaining the whole thing) over on the Unfold blog.
January 12, 2010 permalink
Pretend to be Radiohead with this Instructable guide to 3D light scanning using a projector, camera, and a bit of Processing! This is designed to create the visualization seen in the video above, but you could also use the point data for output on a 3D printer, animation package, etc. Neat.
(Via Make)
January 10, 2010 permalink
GML = Graffiti Markup Language from Evan Roth on Vimeo.
The FAT LAB crew put the markup back in markup language, with their week dedicated to creating new applications and standardizing their existing work around a Graffiti Markup Language, an XML archive format describing tagging and gestural drawing. Rad.
See also: the new DustTag and Fat Tag Deluxe iPhone apps.
August 4, 2009 permalink
http://www.youtube.com/watch?v=BYYX-h4-dpM
Logstalgia (aka ApachePong), a visualizer that turns Apache log file entries into an automated game of OpenGL Pong, with the server-paddle hitting requests back at the calling visitors. Pipe it through SSH and tail to get real-time infoviz. Hey, I’ve seen worse screensavers…
(Via O’Reilly Radar)
July 17, 2009 permalink
A fun LEGO Mindstorms NXT sequencer project from Damien Key of Domabotics. I like the simplicity of this design (and the whirring of the LEGO motor adds something to the sound, almost like the scratchiness of vinyl).
(Via)