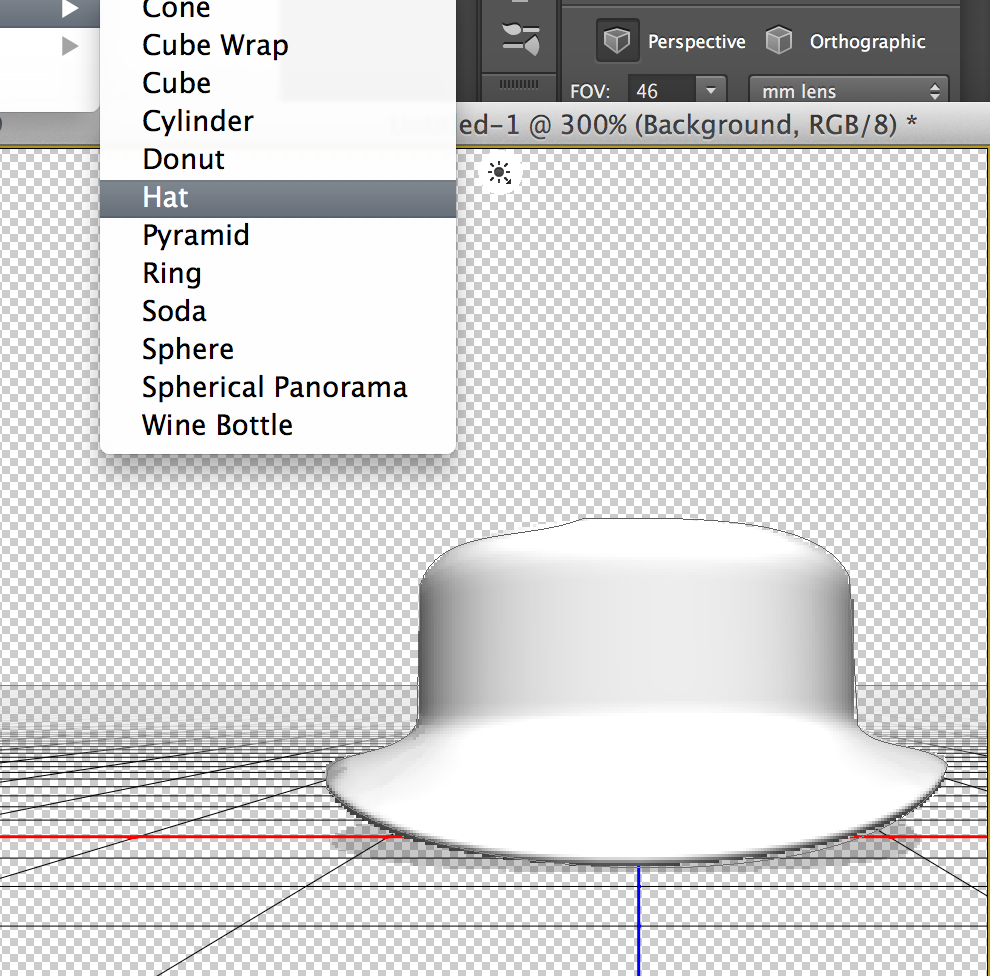
How long has Photoshop had a “Hat” feature? It makes hats.
Tag: graphics
-
How Long Has Photoshop Had a Hat Feature It
-
Kittydar
Hmm, @harthvader has written some impressive neural network, machine learning, and image detection stuff, shared on her GitHub — wait, she’s combined these things into a JavaScript cat-detecting routine?! Okay, that wins.
var cats = kittydar.detectCats(canvas);
console.log(“there are”, cats.length, “cats in this photo”);
console.log(cats[0]);
// { x: 30, y: 200, width: 140, height: 140 }You can try out Kittydar here.
(Via O’Reilly Radar)
-
Pareidoloop
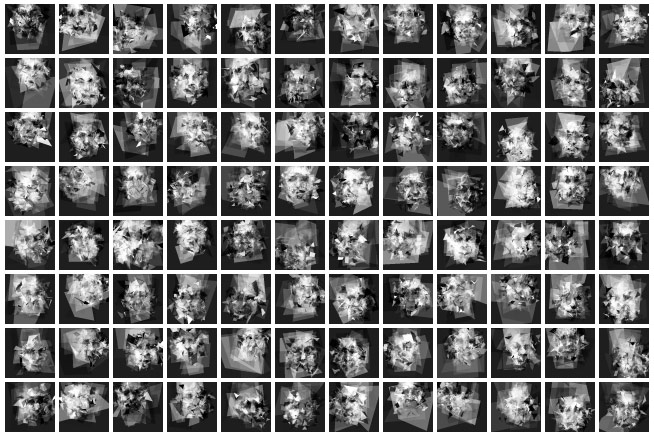
What happens if you write software that generates random polygons and the software then feeds the results through facial recognition software, looping thousands of times until the generated image more and more resembles a face? Phil McCarthy’s Pareidoloop. Above, my results from running it for a few hours. Spooky.
(More about his project on GitHub, and more about pareidolia in case the name doesn’t ring a bell)
[8/5 Update: Hi folks coming in from BoingBoing and MetaFilter! Just want to reiterate that I didn’t write this software, the author is Phil McCarthy @phl !]
-
First Computer Graphics Film at T Satellite
Now that I have a retina display, I want a screensaver that looks as good as this 1963 AT&T microfilm video:
This film was a specific project to define how a particular type of satellite would move through space. Edward E. Zajac made, and narrated, the film, which is considered to be possibly the very first computer graphics film ever. Zajac programmed the calculations in FORTRAN, then used a program written by Zajac’s colleague, Frank Sinden, called ORBIT. The original computations were fed into the computer via punch cards, then the output was printed onto microfilm using the General Dynamics Electronics Stromberg-Carlson 4020 microfilm recorder. All computer processing was done on an IBM 7090 or 7094 series computer.
-
Google X Cat Image Recognition
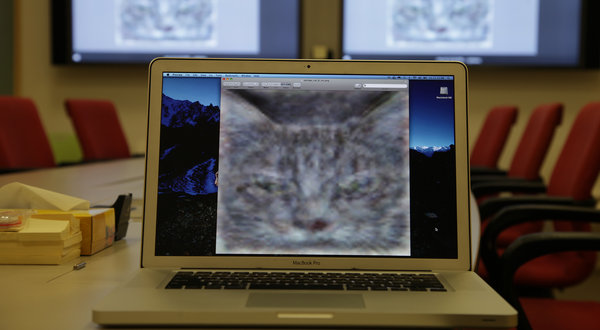
The Internet has become self-aware, but thankfully it just wants to spend some time scrolling Tumblr for cat videos. From the NY Times, How Many Computers to Identify a Cat? 16,000:
[At the Google X lab] scientists created one of the largest neural networks for machine learning by connecting 16,000 computer processors, which they turned loose on the Internet to learn on its own.
Presented with 10 million digital images found in YouTube videos, what did Google’s brain do? What millions of humans do with YouTube: looked for cats. The neural network taught itself to recognize cats, which is actually no frivolous activity.
(Photo credit: Jim Wilson/The New York Times)
-
Captain Picards Utah Teacup
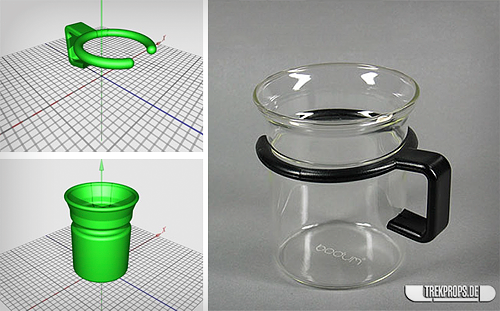
As the Make post says, this 3D-printable model of Captain Picard’s teacup would be a good benchmark for the nascent fabrication technology (the image on the right is a photo of the original Star Trek prop, which was just an off-the-shelf Bodum teacup). That it could be seen as a sly progression from the famous Utah teapot I think makes it an especially worthy benchmark!
Obligatory: “Tea! Earl Grey. Hot.”
-
The visibilizing analyzer
The Language Log on how science fiction often misses the mark with predictions of technology (the why is up for debate, of course):
Less than 50 years ago, this is what the future of data visualization looked like — H. Beam Piper, “Naudsonce”, Analog 1962:
She had been using a visibilizing analyzer; in it, a sound was broken by a set of filters into frequency-groups, translated into light from dull red to violet paling into pure white. It photographed the light-pattern on high-speed film, automatically developed it, and then made a print-copy and projected the film in slow motion on a screen. When she pressed a button, a recorded voice said, “Fwoonk.” An instant later, a pattern of vertical lines in various colors and lengths was projected on the screen.
This is in a future world with anti-gravity and faster-than-light travel.
The comments that follow are a great mix of discussion about science fiction writing (why do the galactic scientists in Asimov’s Foundation rely on slide rules?) and 1960s display technology limitations (vector vs. raster, who will win?). I like this site.
-
GelSight 3D Rubber Imaging
GelSight, a high-resolution, portable 3D imaging system from researchers at MIT, basically what looks like a small piece of translucent rubber injected with metal flakes. Watch the video to see some of the microscopic scans they’re able to get using this. I love non-showy SIGGRAPH tech demos like this one.
(Via ACM TechNews)
-
Nomographs
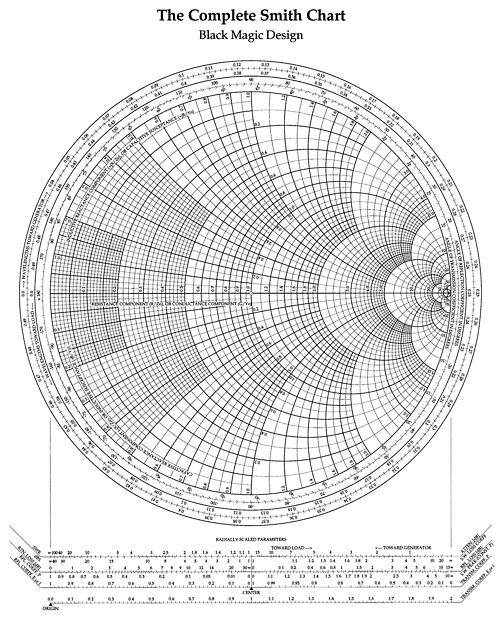
From a post titled The Art of Nomography on Dead Reckonings (a blog dedicated to forgotten-but-beautiful mathematical systems! I’d better subscribe to this one…) :
Nomography, truly a forgotten art, is the graphical representation of mathematical relationships or laws (the Greek word for law is nomos). These graphs are variously called nomograms (the term used here), nomographs, alignment charts, and abacs. This area of practical and theoretical mathematics was invented in 1880 by Philbert Maurice d’Ocagne (1862-1938) and used extensively for many years to provide engineers with fast graphical calculations of complicated formulas to a practical precision.
Along with the mathematics involved, a great deal of ingenuity went into the design of these nomograms to increase their utility as well as their precision. Many books were written on nomography and then driven out of print with the spread of computers and calculators, and it can be difficult to find these books today even in libraries. Every once in a while a nomogram appears in a modern setting, and it seems odd and strangely old-fashioned—the multi-faceted Smith Chart for transmission line calculations is still sometimes observed in the wild. The theory of nomograms “draws on every aspect of analytic, descriptive, and projective geometries, the several fields of algebra, and other mathematical fields” [Douglass].
More about nomograms and abacs on Wikipedia.
(Via O’Reilly Radar)
-
Anonymizing the photographer
Via New Scientist, research into an image processing technique designed to mask the actual physical position of the photographer, by creating an interpolated photograph from an artificial vantage point:
The technology was conceived in September 2007, when the Burmese junta began arresting people who had taken photos of the violence meted out by police against pro-democracy protestors, many of whom were monks. “Burmese government agents video-recorded the protests and analysed the footage to identify people with cameras,” says security engineer Shishir Nagaraja of the Indraprastha Institute of Information Technology in Delhi, India. By checking the perspective of pictures subsequently published on the internet, the agents worked out who was responsible for them. …
The images can come from more than one source: what’s important is that they are taken at around the same time of a reasonably static scene from different viewing angles. Software then examines the pictures and generates a 3D “depth map” of the scene. Next, the user chooses an arbitrary viewing angle for a photo they want to post online.
Interesting stuff, but lots to contemplate here. Does an artificially-constructed photograph like this carry the same weight as a “straight” digital image? How often is an individual able to round up a multitude of photos taken of the same scene at the same time, without too much action occurring between each shot? What happens if this technique implicates a bystander who happened to be standing in the “new” camera’s position?
