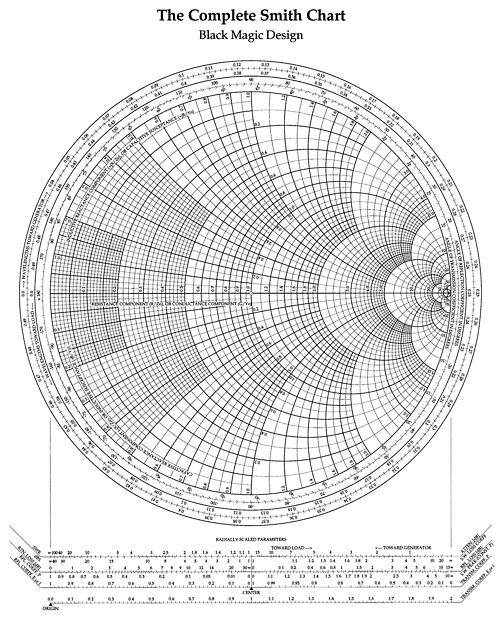
From a post titled The Art of Nomography on Dead Reckonings (a blog dedicated to forgotten-but-beautiful mathematical systems! I’d better subscribe to this one…) :
Nomography, truly a forgotten art, is the graphical representation of mathematical relationships or laws (the Greek word for law is nomos). These graphs are variously called nomograms (the term used here), nomographs, alignment charts, and abacs. This area of practical and theoretical mathematics was invented in 1880 by Philbert Maurice d’Ocagne (1862-1938) and used extensively for many years to provide engineers with fast graphical calculations of complicated formulas to a practical precision.
Along with the mathematics involved, a great deal of ingenuity went into the design of these nomograms to increase their utility as well as their precision. Many books were written on nomography and then driven out of print with the spread of computers and calculators, and it can be difficult to find these books today even in libraries. Every once in a while a nomogram appears in a modern setting, and it seems odd and strangely old-fashioned—the multi-faceted Smith Chart for transmission line calculations is still sometimes observed in the wild. The theory of nomograms “draws on every aspect of analytic, descriptive, and projective geometries, the several fields of algebra, and other mathematical fields” [Douglass].
More about nomograms and abacs on Wikipedia.
(Via O’Reilly Radar)

